
MLB · Visual analytics

MLB Statcast spray charts
for hitter research.

Courtside brings Statcast batted-ball evidence into the same chat as matchup analysis, player props, DFS decisions, and game research.

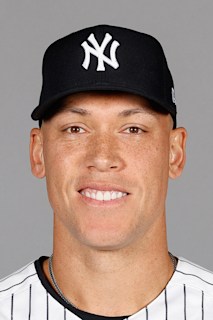
Aaron Judge
Yankees· OF· 2024· 389 batted balls
Live in chatSpray chart · live Statcast events
Data view
Batted-ball locations and outcomes
Metrics
Exit speed · launch angle · expected results
Use cases
Props · DFS · scouting · regression
Output
Spray charts and cited summaries
Primary keyword
MLB Statcast spray charts
Search intent
Analyze a hitter's batted-ball distribution, contact quality, and matchup fit from Statcast data.
Updated
May 30, 2026
How it works4 steps

From question to inspectable answer.

  1. I
    Step 1
    Pick the hitter

    Name the player and the window.

    Spray charts are most informative on enough plate appearances to read direction. Courtside defaults to a full season but you can scope to recent form or a split.

    Example

    Show Aaron Judge's 2026 spray chart and summarize his power lanes.

  2. II
    Step 2
    Layer the metrics

    Pull contact speed, launch angle, and expected results into the same answer.

    Statcast indicators reveal whether outcomes are sustainable. Hard contact with a high pull rate behaves differently than the same line drive going the other way.

    Example

    What is Judge's expected power and hard-hit rate this season versus last?

  3. III
    Step 3
    Read the matchup

    Compare contact quality against the opposing staff.

    The same chart can be filtered by pitcher hand, pitch type, or last-30 form. That tells you whether the matchup respects or breaks the hitter's pull-side tendency.

    Example

    Compare Judge vs RHP vs LHP starters in the last 30 days.

  4. IV
    Step 4
    Turn it into a bet

    Use the picture to pressure-test a market.

    Total bases, home runs, and DFS chalk picks all benefit from spatial context. Courtside applies the same verdict math used elsewhere.

    Example

    Use Statcast to evaluate Judge over 1.5 total bases tonight.

What it doesCapabilities

Three layers, one conversation.

01 / Batted balls

See where the contact actually lands.

A hitter's stat line can tell you what happened. A spray chart helps explain how it happened by mapping contact direction, landing spots, and outcome types.

  • I

    Separate pull-heavy power from all-fields contact.

  • II

    Spot ground-ball, fly-ball, and extra-base-hit patterns.

  • III

    Use visible contact distribution to support prop or DFS research.

02 / Statcast context

Pair the picture with contact-quality metrics.

Courtside can connect spray chart evidence to Statcast indicators such as exit velocity, hard-hit rate, launch angle, expected batting average, and expected slugging.

  • I

    Use expected stats to identify overperformance or underperformance.

  • II

    Compare contact quality against the opposing pitcher or bullpen.

  • III

    Bring weather and park context into the same analysis when relevant.

03 / Chat workflow

Move from chart to decision without opening another dashboard.

Once the chart is in the thread, ask follow-up questions about one hitter, the opposing staff, game total, or DFS value.

  • I

    Ask for a hitter's best and worst matchup signals.

  • II

    Compare multiple hitters on the same slate.

  • III

    Turn the evidence into a concise memo for a prop or lineup decision.

GlossaryTerms used throughout this page

A short dictionary for MLB Statcast spray charts.

01
Exit speed
Speed of the ball off the bat. Harder contact is more likely to become extra bases.
02
Launch angle (LA)
The vertical angle of the ball off the bat. It helps separate fly balls, line drives, and ground balls.
03
Expected batting stats
Expected batting average and expected slugging. These estimate what contact quality usually produces, before defense and luck affect the result.
04
HardHit %
Share of batted balls with exit velocity at or above 95 mph.
Common questionsAnswered

Frequently asked, cleanly answered.

Q1.

Can Courtside make MLB spray charts?

Yes. Courtside can render MLB spray charts from Statcast batted-ball data and summarize the hitter profile in the same answer.

Q2.

What can a spray chart tell me?

It can show batted-ball direction, landing patterns, outcome clusters, and whether a hitter's production is tied to sustainable contact quality.

Q3.

Can I use Statcast charts for DFS or prop research?

Yes. Spray charts and expected stats are useful context for total bases props, hitter value, and matchup quality.

Q4.

Does Courtside compare Statcast splits by pitch type?

Yes. You can ask for spray charts and contact quality filtered by pitcher handedness, pitch type, or recent date range.

Stop dashboard-hopping.
Ask a question.

Join the Discord for pick notes, slate questions, product drops, and smarter NBA and MLB conversation.